Watch traffic from the dashboard
The dashboard pulls live Cloudflare Workers analytics straight from your account. Lettle never proxies the data — we just render it.
-
Open the website dashboard
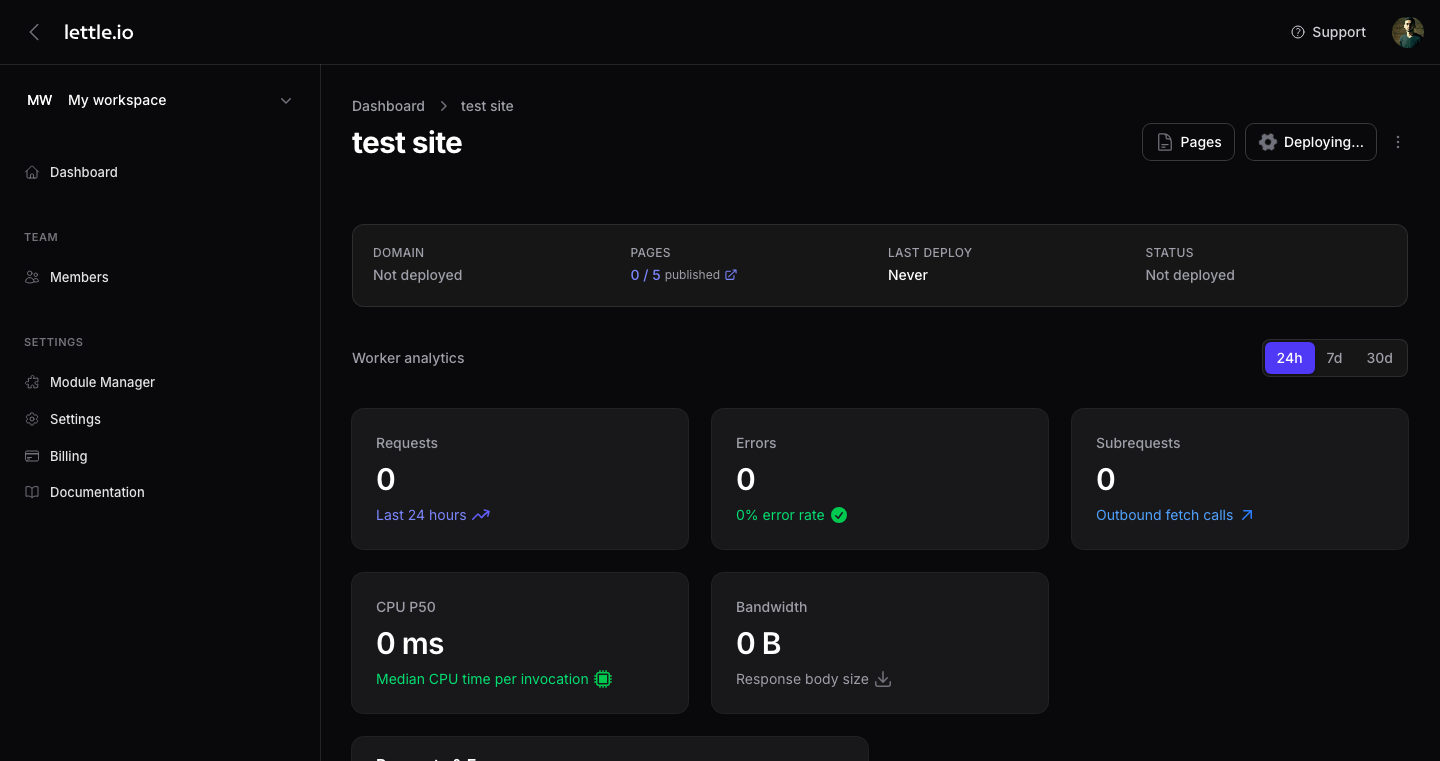
From the websites grid, click into a site card. Its dashboard tab is the default view and aggregates the last 24 hours of Workers analytics.
-
Read the top-line tiles
Requests, Errors (with error rate), Subrequests (with outbound fetch count), CPU P50, and Bandwidth — all pulled live from your Cloudflare account.
-
Use the chart
The Requests & Errors chart plots both metrics over time so you can spot spikes and 5xx blips quickly.
-
Pick a different range
Use the period filter in the analytics header to switch between 24h, 7d, and 30d. The Deploy button in the page header is the same one used to ship a new build.
Tip
If the dashboard shows zeros, deploy first — analytics only appear once a site has real traffic on Cloudflare.